A popular topic in the direct marketing industry is the use of statistics-based predictive models to optimize mailing strategies. A common thread throughout many of these discussions is that predictive models, although powerful segmentation tools, are cost-justified only for the largest of mailers.
This article will show how predictive models are appropriate even for modestly sized direct marketers. We will accomplish this by performing a financial simulation of a single promotion by a fictitious catalog company with 600,000 active customers, using conservative assumptions.
This promotion will be segmented first by traditional RFM Cells and then by a statistics-based predictive model. We will see how an investment of, say, $25,000 in a predictive model will return an incremental $18,000 in revenue and $68,000 in profit over traditional RFM Cells after just one promotion. At $68,000 per promotion, it is clear that the profitability gains over a full year's mailing cycle are profound!
The starting point for our financial simulation is the underlying promotion assumptions listed in Table 1:
Table 1
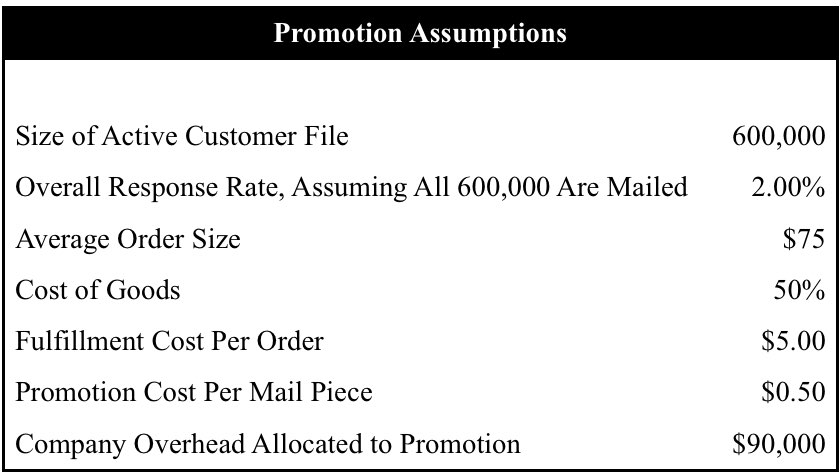
Although most of these assumptions are self-explanatory, I will elaborate on two:
- The overall response rate, assuming the promotion of all 600,000 customers, is 2.0%. As we will see in a moment, this indiscriminate promotion strategy generates exactly $0 in profit.
- The company overhead allocated to our promotion is $90,000, which is a fraction of the total overhead that must be covered throughout an entire year.
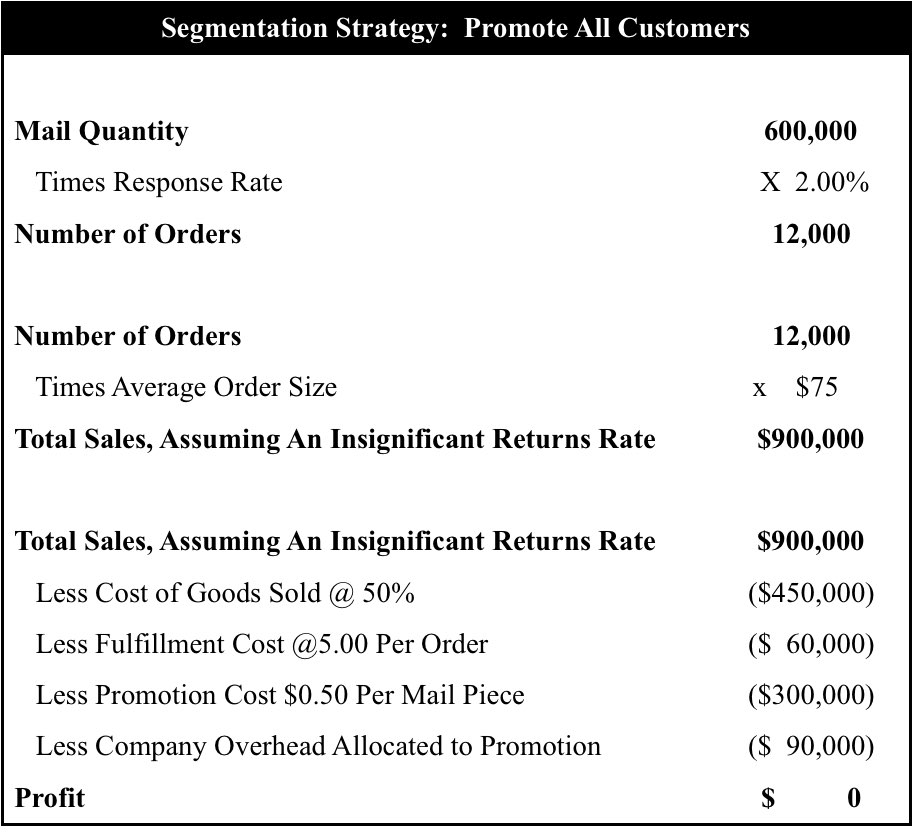
Organizing these promotion assumptions into the simple worksheet illustrated in Table 2 shows how mailing all 600,000 customers generates $900,000 in sales but $0 in profit. With nothing left over for critical functions such as customer acquisition, indiscriminate mailing results in a business with no future. What is needed to ensure long-term viability is some kind of segmentation strategy.
Table 2
For many decades, direct marketers have understood the need for segmentation. Traditionally, they have resorted to RFM Cells, which entails the grouping of customers with similar recency, frequency and monetary purchase history. (Many permutations of this approach are used, some of which incorporate additional criteria such as product category and inception media.)
The idea behind any RFM approach, as well as other segmentation strategies, is to identify and eliminate from the promotion all individuals whose predicted performance is below breakeven. Therefore, it is imperative that we first establish the breakeven response rate for our catalog promotion. And this, as outlined in the Table 3 worksheet, is 1.54%:
Table 3
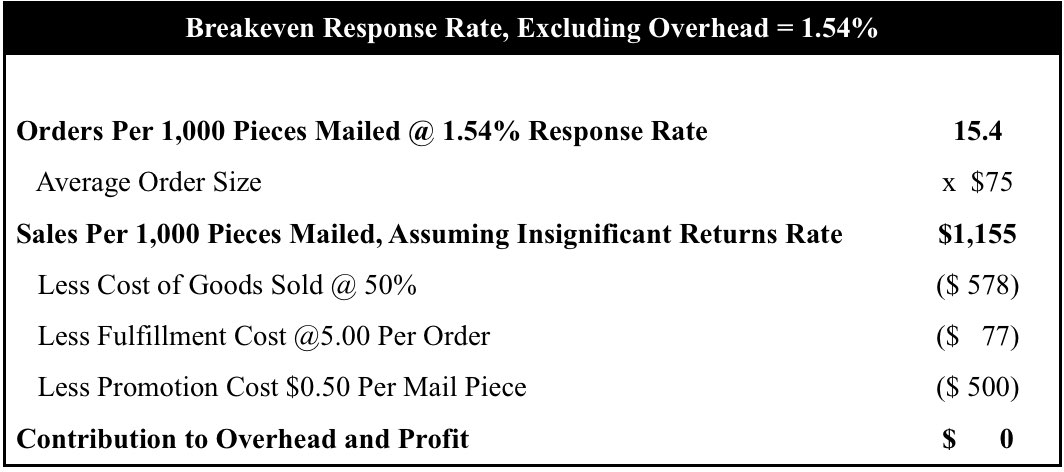
Note that the breakeven response rate has been calculated without regard to company overhead. Although the reason for this is philosophical, I believe it to be sound:
Breakeven is a consideration only at the margin; that is, for those customers who are borderline candidates for promotion. If company overhead has not already been comfortably covered by the more productive customer segments, then structural business problems exist that even segmentation will not cure.
Table 4-A illustrates just how an RFM segmentation strategy works. Before discussing this in detail, however, some background information is necessary:
- For the sake of simplicity, only 10 RFM Cells have been created. In reality, I have seen RFM segmentation strategies that range from a few simple cells to one that numbered in the thousands.
- For our example, the absolute number of cells is not important. Instead, the key issue is how well they differentiate those customers who are likely to respond from those who are not. And the measurement of this discriminatory power involves a concept called "lift."
- Lift in Table 4-A is defined as the ratio of a given RFM Cell's response rate to the overall response rate of 2.00%. For the top 10% of the file, which is defined by Cell 1, the response rate of 4.00% translates into a ratio-to-average of 2.00 (i.e., 4.00% / 2.00%). The bottom 10% or Cell 10, on the other hand, has a ratio-to-average or "lift" of 0.40 (i.e., 0.80% / 2.00%).
- Although in the real world one never sees RFM Cells of equal 10% quantities, a lift of 2.00 for the cells that correspond to the approximately-top 10% best customers is better-than-average performance for a typical catalog. Although I've seen lifts higher than the low 2's, it is not common.
(As an aside, some readers "mindful of the adage that 20% of the customers generally account for 80% of the sales "will be skeptical of this modest lift assumption. Keep in mind that, after the fact, we can identify with absolute certainty the best-performing 20% of a given customer base, and then measure its performance.
What we are attempting to do here is both different and difficult, and that is to predict the best customers. Unfortunately, this can never be done with anything near absolute accuracy. In other words, the composition of our magical 20% changes all the time, which "in turn "degrades significantly the often-quoted 80% as we look to the future!)
Table 4-A: Segmentation Strategy #1 "RFM Cells
(1.54% = Breakeven Response Rate)
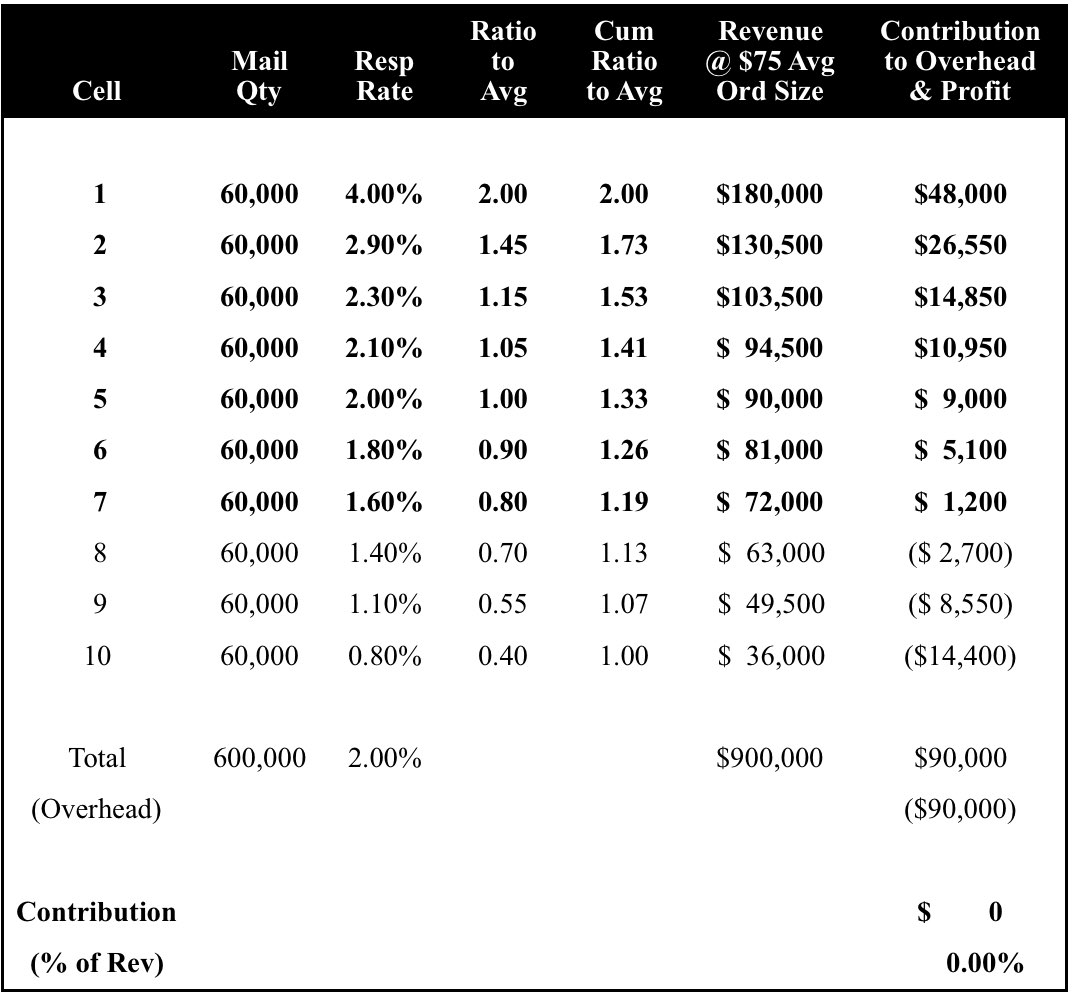
As we see in Table 4-A, RFM Cells, as with any other segmentation strategy, do nothing more than re-sequence the customer file from most to least likely to respond. This is why, if our cataloger mails all ten RFM Cells, the total revenue will remain at $900,000 and the total profit at $0.
Notice that the Contribution to Overhead and Profit for Cells 8, 9 and 10 is negative $2,700, $8,550 and $14,400 respectively, which is not surprising given that their corresponding response rates of 1.40%, 1.10% and 0.80% are below our 1.54% breakeven. Although these cells are generating incremental revenue, overall profitability is being lowered in the process. We would be better off sacrificing this additional revenue for the sake of the bottom line.
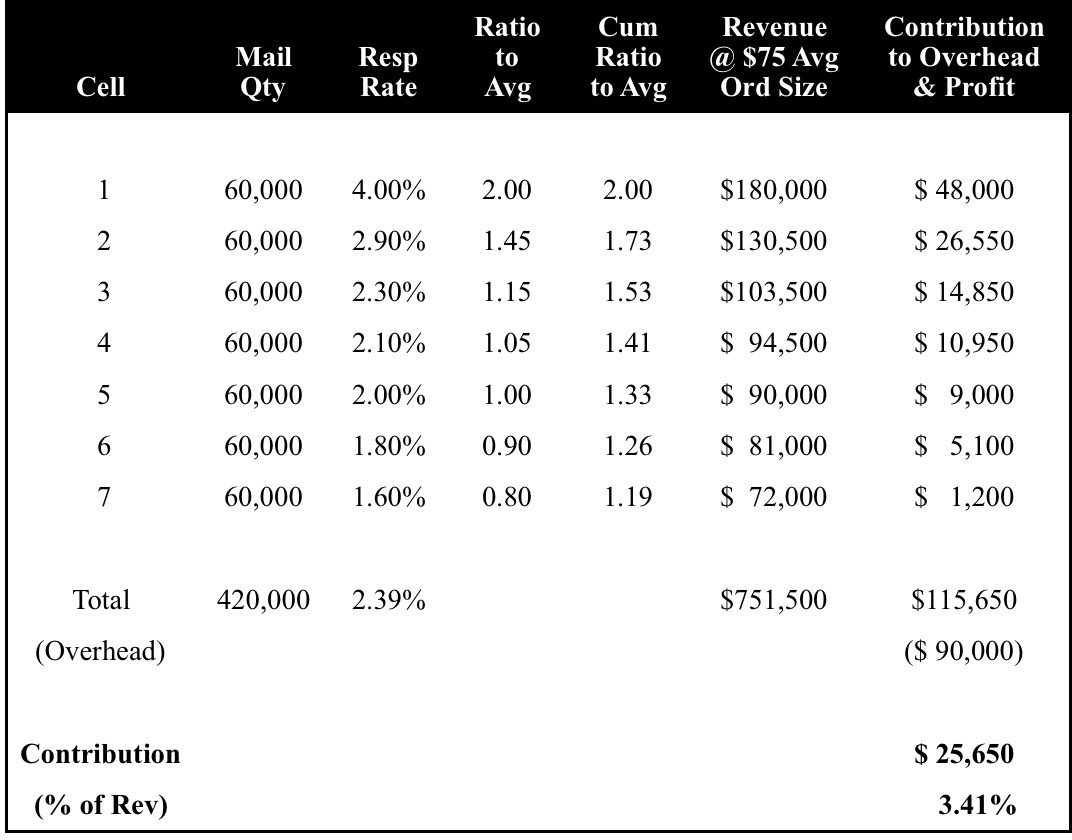
Table 4-B illustrates the effect of mailing only the seven profitable RFM Cells. Although revenue is down almost $150,000, to $751,500, we now have a mailing that is $25,650 in the black, or 3.41% of total sales. Although not outstanding, it is a significant improvement over indiscriminately mailing the entire file.
Table 4-B: RFM Cells (cont.)
(1.54% = Breakeven Response Rate)
(To be continued.)
