This month's article continues the discussion of several analytical traps that frequently snare the untrained when evaluating profile reports. Only by avoiding these traps can demographic overlay data be properly leveraged to improve your company's top and bottom lines. (The first two articles were published in the April 7 and September 8, 2003 issues.)
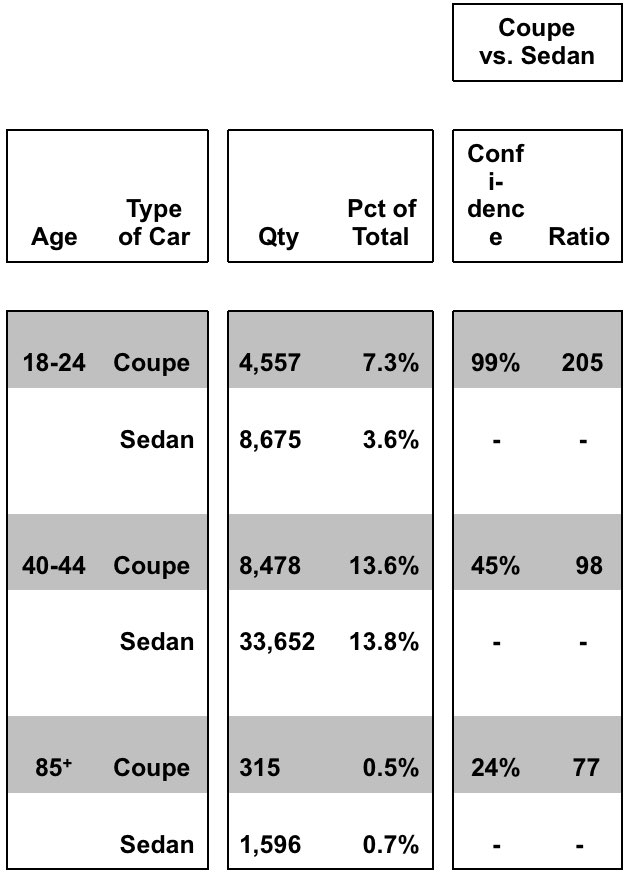
This month's focus is on Confidence Levels ("Confidence") and Ratios, which are the foundation of any profile report. To illustrate, we will employ an expanded version of the Age of Head of Household chart that appeared in the September 8 article. Specifically, we will concentrate on the Age ranges of 18-24, 40-44, and 85+:
Confidence Levels
Confidence Level is the degree of certainty that a result did not occur because of chance variations in the corresponding samples. For example, we are 99% confident that there really is a higher penetration rate of 18-24 year olds among Coupe buyers than among Sedan buyers. However, we are only 45% and 24% confident, respectively, that 40-44 and 85+ year olds are more highly penetrated among Coupe buyers.
The Confidence statistic is frequently misunderstood. It does not, for example, translate to 99% Confidence that the 18-24 penetration rate within Coupe buyers is exactly 7.3% and 3.6% within Sedan buyers. Instead, it means we can be 99% certain that the penetration rate among Coupe buyers (regardless of the specific amount) is higher than among Sedan buyers (regardless of the specific amount).
Often, direct marketers employ Confidence Levels of 90% or even 95% as the dividing line between "statistically significant" and "statistically insignificant" results. However, there are hazards associated with this approach. Just about any direct marketer, for example, would dismiss a 67% Confidence Level as being statistically insignificant. However, this translates to 2-to-1 odds that a difference really does exist. Often, odds such as this are worth additional investigation!
Therefore, the Confidence statistic should be considered an aid to decision making, and not a rigid rule that offers no option but total acceptance or rejection of an observed result. It is important to allow yourself the option of drawing a "maybe" conclusion, where additional sampling is employed to arrive at a definitive finding.
The Confidence statistic is sensitive to sample sizes. Generally, very small samples correspond to a low level of Confidence. This is consistent with the expectation that the results of small samples are often nothing more than chance occurrences. This sensitivity to sample size is a strength as well as weakness in real-world decision-making. If the sample size is extremely large, then the Confidence Level often is very large, even though the difference between the two percentages is not sufficiently consequential to have any practical application.
Given extremely large sample sizes, almost any non-zero difference between two percentages will display a high enough level of Confidence to be deemed "statistically significant." Consider, for example, the respective penetration rates of 13.6% and 13.8% for Age 40-44 within Coupe and Sedan buyers:
With the current sample sizes, our Confidence that the two rates are different is only 45%. However, if we were to increase the sample sizes to 160,000, we would achieve a Confidence of 95%. Nevertheless, there would still be no practical difference between 13.6% and 13.8%.
Ratios
A Ratio is a measure of the magnitude of difference between one value versus a second, or "base," value. Typically, a Ratio is obtained by dividing the first value by the second, multiplying the result by 100, and then rounding to a whole number.
If the Ratio is 100, then the two values are identical. If it is than greater than 100, then the first value is higher than the second. If it is less, then the first is smaller. Therefore, for the 18-24 Age range, the Ratio of 205 means that the penetration rate among Coupe buyers is 2.05 times (or 105% of) Sedan buyers. (Note: If you do the math using the chart's penetration rates of 7.3% and 3.6%, you will arrive at a Ratio of 203. The discrepancy is due to rounding.)
Unlike a Confidence statistic, a Ratio does not take into account chance differences, nor is it sensitive to the sample sizes upon which the underlying percentages are based. This is apparent within the 85+ Age range, where the Coupe-to-Sedan Ratio is 77. However, the sample size is so low that the Confidence is only 24%.
Another limitation of the Ratio is that it can be impressively small or large even though the two percentages being compared are inconsequentially small. For example, if Coupe buyers for the 85+ Age range were 0.1%, then its Ratio versus the 0.7% for Sedan buyers would be an extremely low 14. However, because the corresponding percentages for both Coupe and Sedan buyers would be under 1%, the practical marketing applications would be inconsequential.
Finally, a Ratio that compares two percentages is mathematically constrained because the percentages themselves have a ceiling of 100. Therefore, as the "baseline" percentage approaches this upper limit, the maximum possible value of the Ratio gets reduced. For example, given the Age 40-44 penetration of 13.8% within Sedan buyers, the theoretical maximum Ratio for Coupe buyers is 725 (i.e., 100% divided by 13.8%). However, if the Sedan penetration were 80%, the maximum Ratio would be just 125.
Conclusion
Technically, there is no direct relationship between the Confidence statistic and the Ratio. In other words, a Ratio does not have a Confidence statistic attached to it. Instead, the Confidence statistic is nothing more than a number that indicates the likelihood that two percentages are different. However, when the percentages and associated sample sizes are not extremely large or small, the Confidence statistic and Ratio tend to "line up," and tell the same story about comparative sizes of the two percentages.
Confidence statistics and Ratios should be interpreted holistically, and with great care. When reviewing a profile report, it is important to focus first on the sample sizes on which the percentages are based. Also, think about the magnitudes of the percentages. Finally, overlay your own judgment of the real-world importance of the percentages, and their associated universe counts. The combination of statistics with human judgment is the best recipe for improved business clarity and better decisions.
(For additional reading on this topic, see "Individual/Household Demographics & Psychographics: Applications in Descriptive & Predictive Research," The Direct Marketing Association's 1997 Research Council Journal, www.wheatongroup.com.)
